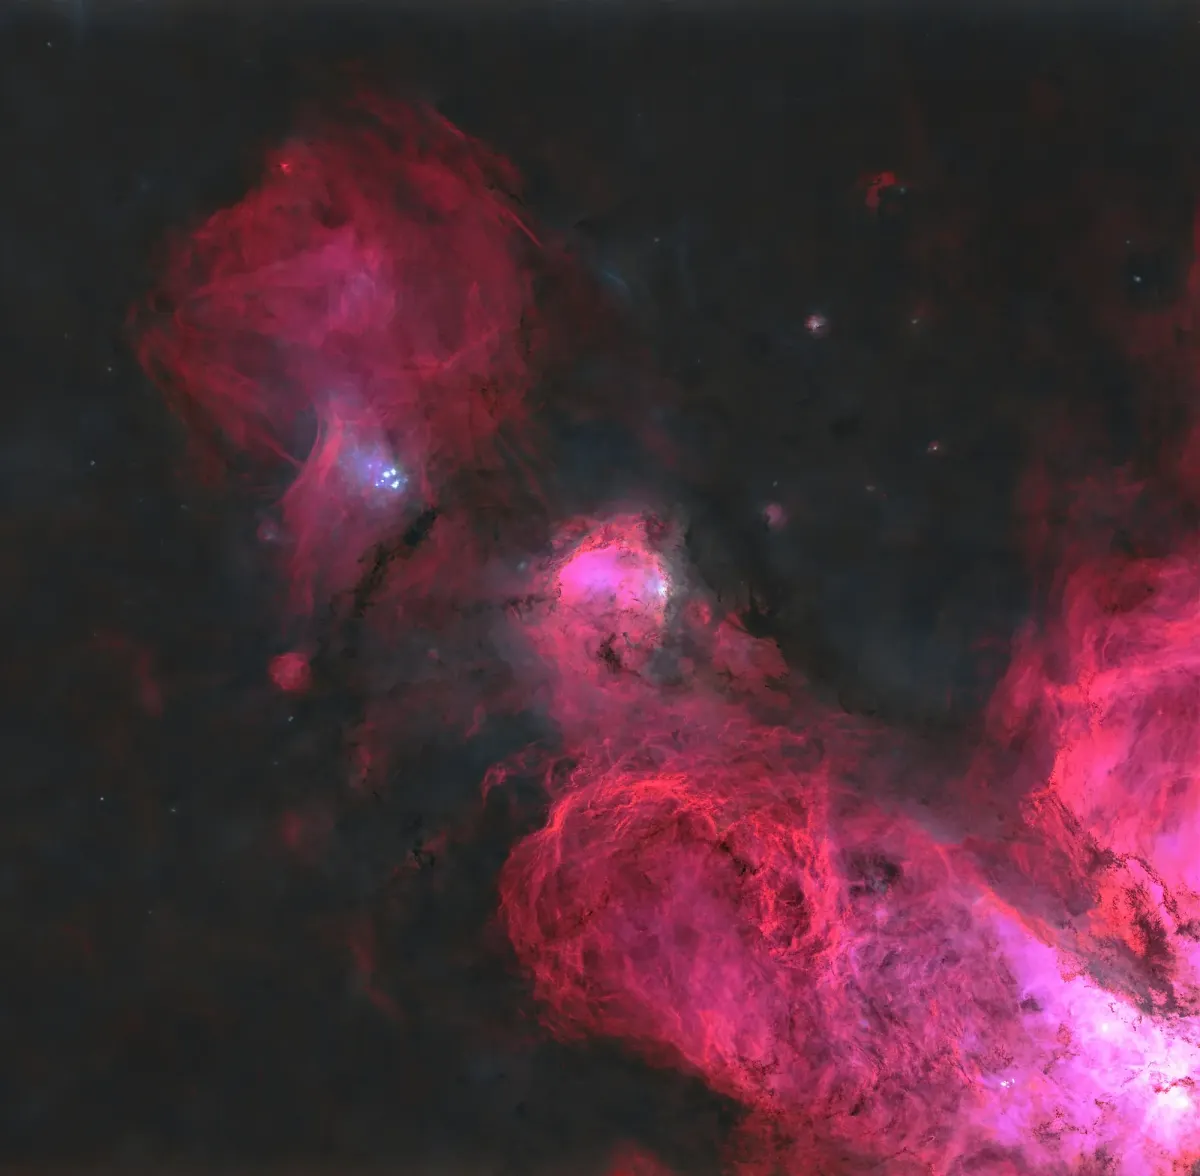
This free integration time calculator helps astrophotographers plan how much total exposure a deep-sky target needs and how to split it into sub-exposures across nights. Enter your target, sky conditions, and gear for a realistic imaging plan.
How total integration time is calculated
Integration time is the one lever that always works. Every other improvement — darker skies, a faster scope, a quieter camera — changes how efficiently you collect photons, but the noise in a stacked image always falls as the square root of the time you spend. This tool works out how much time a given target needs from the same photon-rate model used by our sub-exposure calculator, so the two tools always agree.
The signal and background rates
Both the target and the sky are surface brightnesses in magnitudes per square arcsecond, and both are converted into electrons per pixel per second through the identical optical chain:
rate = P₀ · 10^(−0.4·m) · W · T · A · Ω · QE · τ
where P₀ = 1.0×10⁷ photons·s⁻¹·m⁻²·Å⁻¹ per arcsec² for a V=0 source (the Bessell V zero point, 3640 Jy), m is the surface brightness in mag/arcsec², W is the filter bandwidth in ångströms (a top-hat approximation), T is the filter's peak transmission, A = π(r² − r_obs²) is the unobstructed aperture area in m², Ω = (206.265 · pixel_µm · bin / FL_mm)² is the solid angle one pixel covers in arcsec², and QE and τ are the sensor's quantum efficiency and the optics' transmission. Feed it the target's magnitude and you get S; feed it the sky's and you get B.
The CCD equation
For a stack of total length T made of subs of length t_sub, the per-pixel signal-to-noise ratio on the object is
SNR = S·T / √( (S + B + D)·T + N_r²·(T / t_sub) )
The signal grows linearly with time; the shot noise from the target, the sky and the dark current grows as √T; and read noise is added once per sub, so it grows as √(number of subs). Solving that for the time needed to hit a chosen SNR gives the number this calculator reports:
T = SNR² · ( S + B + D + N_r² / t_sub ) / S²
Two things follow immediately. First, if your subs are long enough that N_r²/t_sub is small next to S + B + D, read noise stops mattering — that is exactly the condition our sub-exposure calculator solves for. Second, from a light-polluted site B dominates the bracket completely, so integration time scales almost linearly with sky brightness: every magnitude of extra light pollution costs you about 2.5× the time.
Why doubling SNR costs four times the time
Because T is proportional to SNR². Going from SNR 10 to SNR 20 does not take twice as long — it takes four times as long. From SNR 20 to SNR 40 is another 4×, or 16× your original session. This is the single most useful fact in imaging planning: the first few hours transform an image, and the tenth hour changes far less than the first. It is also why a genuinely dark sky beats brute-force integration — halving the sky rate buys you the same result in roughly half the time, for free.
What SNR should you aim for?
The figure here is a per-pixel SNR on the target itself. A feature spanning many pixels reads far cleaner than its per-pixel SNR suggests, because averaging N pixels lifts SNR by √N. As a rough guide: SNR ≈ 5 per pixel is a confident detection, ≈ 10 gives a usable image with careful noise reduction, ≈ 20 stretches cleanly, and ≈ 50 supports aggressive stretching and sharpening on the faintest structure.
Frequently asked questions
Where do I find my target's surface brightness?
The brightness classes in the tool are representative mean values, not measurements of a specific object — use them to bracket your target. For a real figure, take the object's integrated magnitude m and its apparent area A in square arcseconds and use μ = m + 2.5·log₁₀(A). Remember that this gives the mean: a galaxy's core can be three magnitudes brighter than its outer arms, so decide which part you are actually trying to render.
Does this work for narrowband?
Only if you enter the target's brightness as seen through that filter. The model treats every source as a flat continuum across the passband, which is right for the sky and for galaxies, but wrong for an emission nebula: its light sits inside the line, so a 3 nm filter cuts the sky by a hundredfold while barely touching the target. Enter your target's broadband magnitude with a narrowband bandwidth and the answer will be far too pessimistic. The tool warns you when the bandwidth drops below 50 nm.
Why doesn't longer sub-exposure always help?
Longer subs only remove the read-noise term N_r²/t_sub. Once that term is small compared with S + B + D, going longer buys you nothing in SNR — it just raises your risk from satellites, wind, guiding errors and saturated stars. Use the sub-exposure calculator to find the point where read noise stops mattering, then put every remaining minute into total time instead.
Does this account for the moon?
Not directly — enter a brighter sky value instead. Moonlight raises the sky background by anything from a few tenths of a magnitude to three magnitudes near full, and the effect depends on the moon's altitude, phase and distance from your target. Drop your SQM figure accordingly and the required time will climb the way it does in practice.
What is not modelled here?
Flat-field and dark-frame calibration noise, sky-estimation error, star saturation, transparency and seeing variation, rejected frames, and the losses of any particular stacking algorithm. Real projects usually need somewhat more time than the theoretical minimum — treat the answer as a floor, and plan roughly 15–25% on top for discarded subs.